

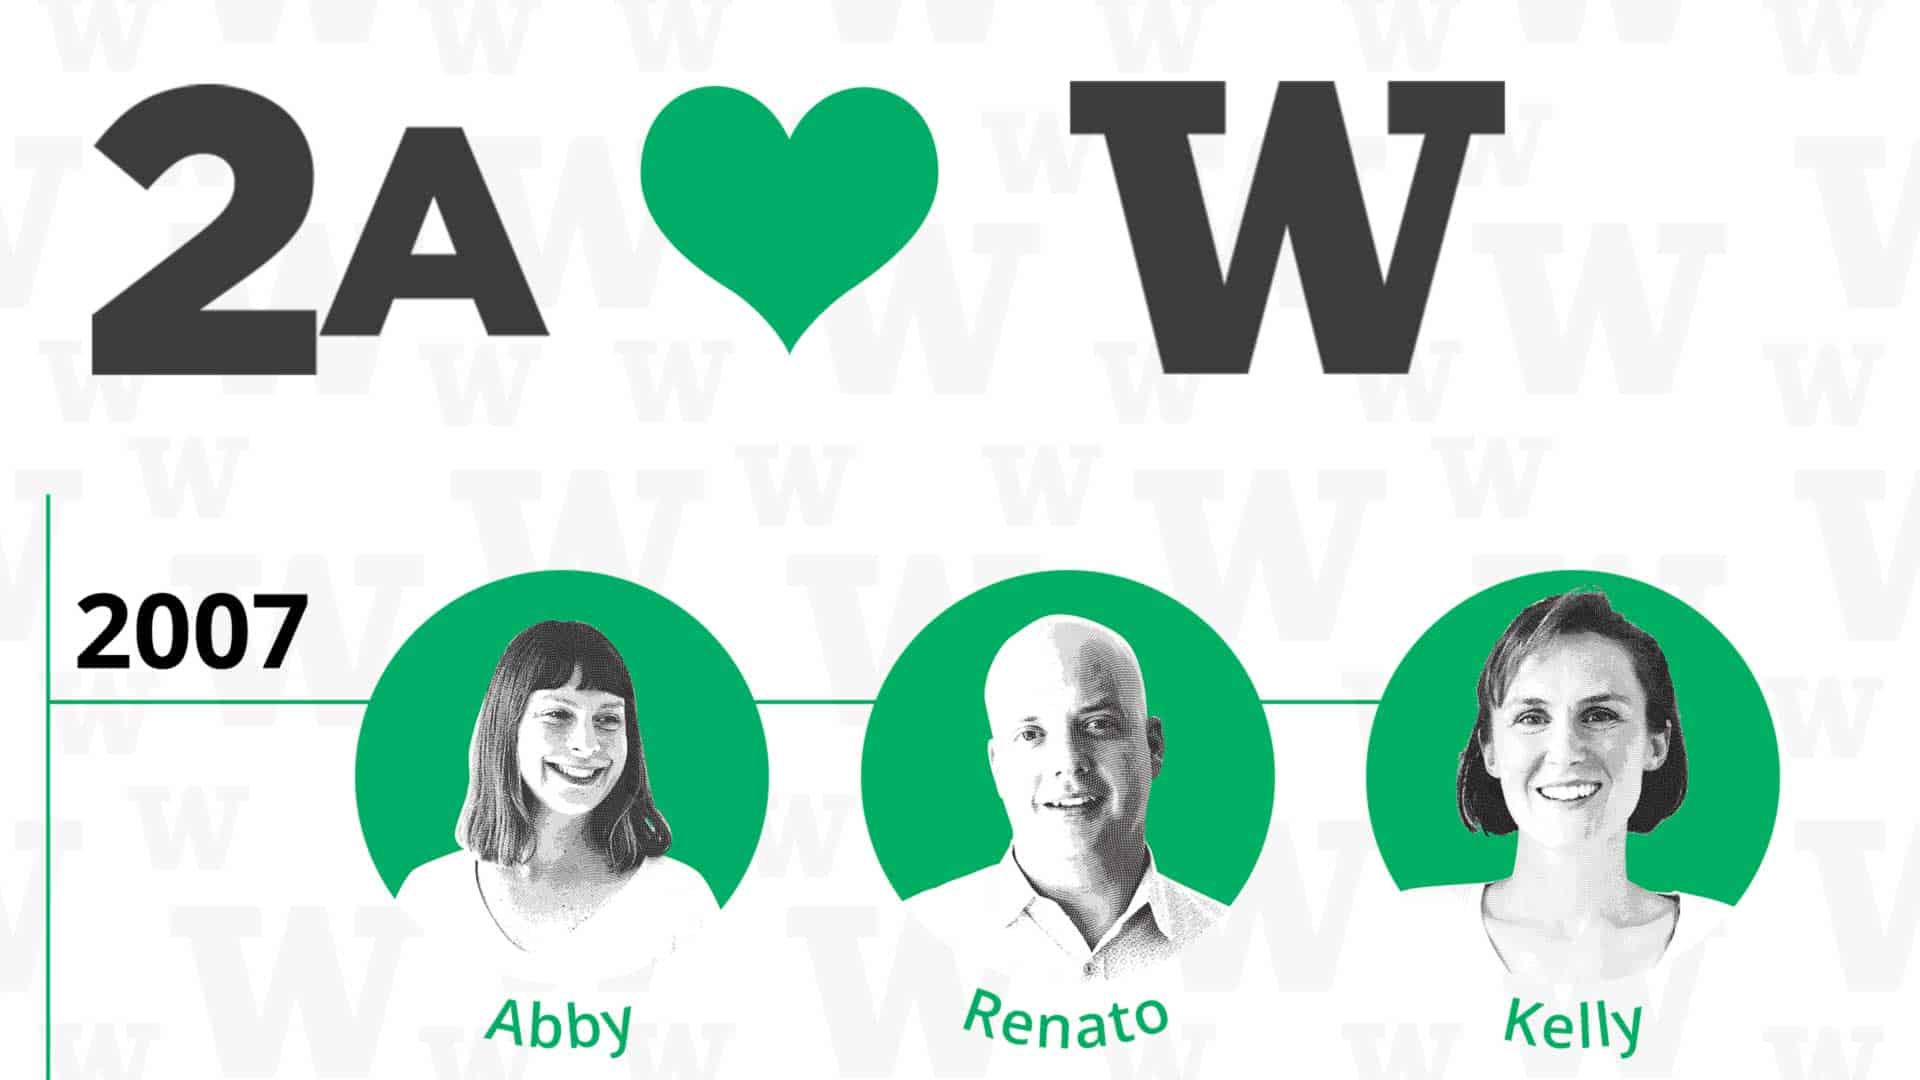
Here at 2A, our roots run deep with University of Washington’s Foster School of Business – as we like to say, we’re “Foster-led and Foster-fed.” The Foster school turns 100 (!) this year, and we jumped at the chance to feature our story on the school’s online centennial timeline. If you scroll through the 2000s until you hit 2007, and you’ll find the post that reveals the little-known 2A backstory.
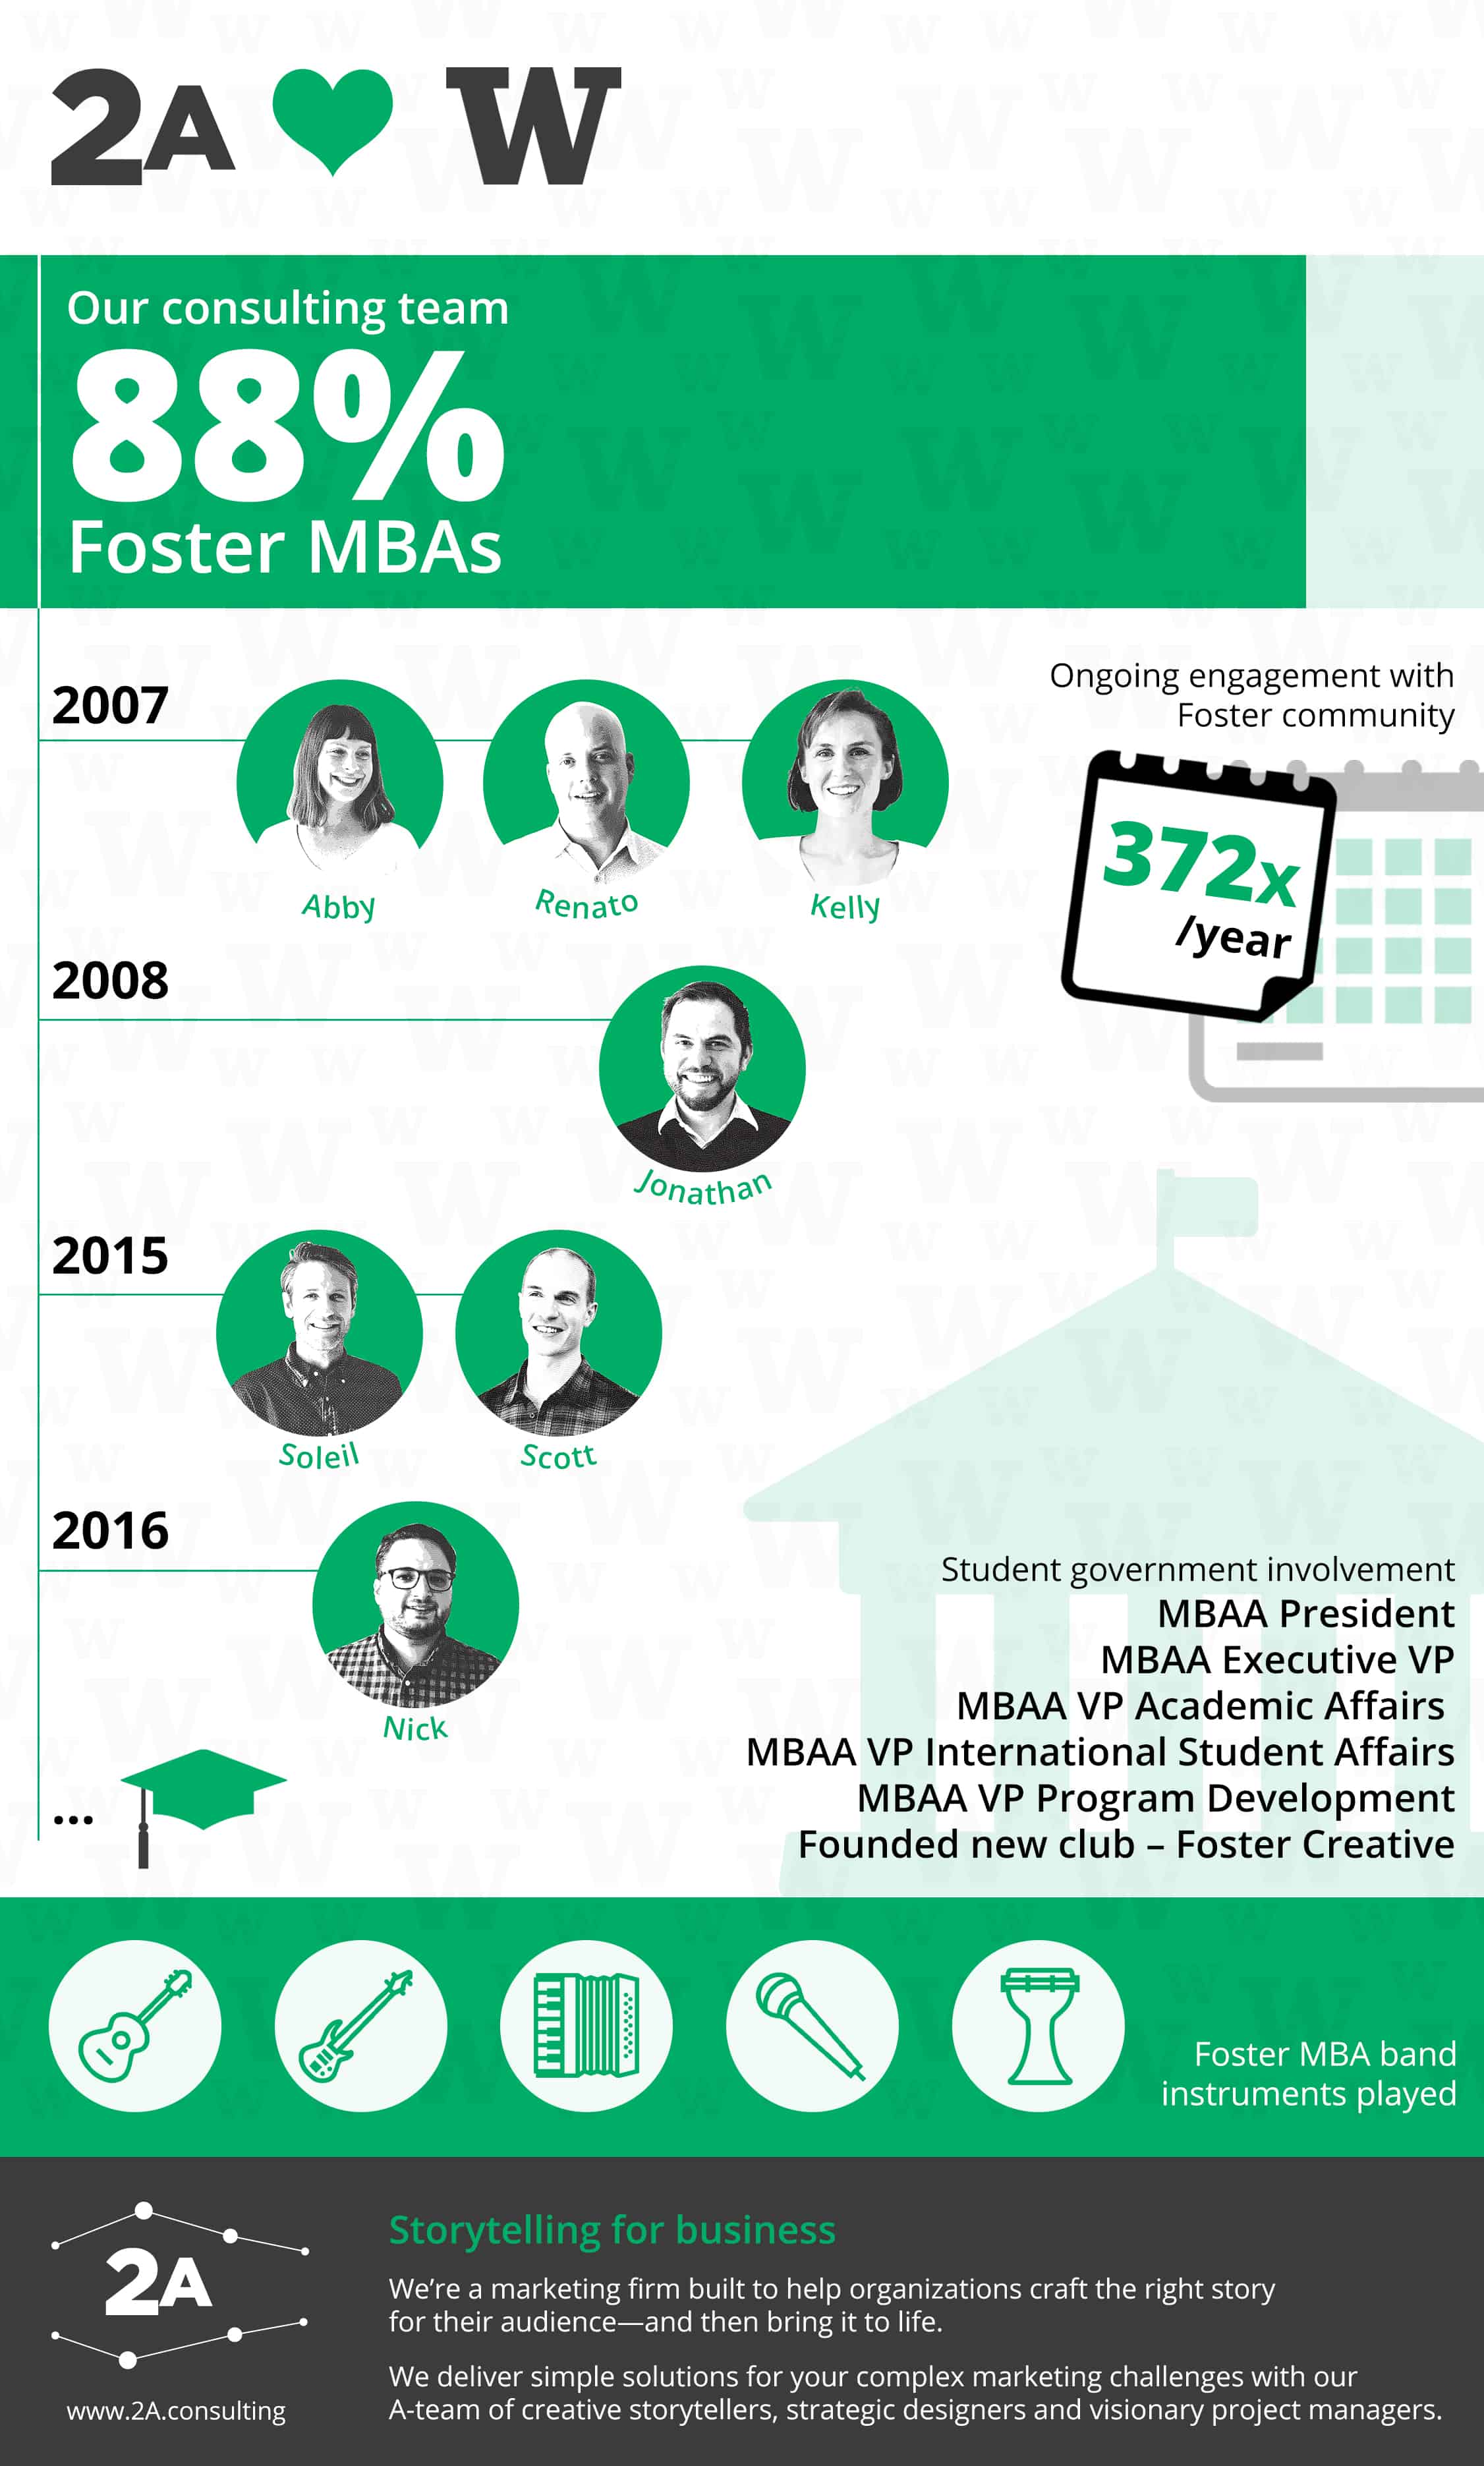
While we could have approached this post as a text-only piece, we opted for an infographic instead. This allowed us to convey several different points in a simple, cohesive visual narrative. It’s why we love infographics: we can flex both our content and design chops in this medium, all in one complete package.
Our clients, particularly the technology product marketing teams we work with, often seek to develop a story that relies on data. The infographics we’ve built for them do this job remarkably well – they concisely and elegantly communicate a data story. For example, in our Foster infographic, the timeline and data points work together to show an alumni relationship that spans time and flourishes in the present. And yes, we really did play all those instruments!
Are you thinking about using infographics to tell your story – but not sure where to start? Drop us a line; we’d love to chat with you!