Infographics
Some stories aren’t meant to be read line by line; they’re meant to be seen first.
Is it a chart? A diagram? An illustration doing a little extra work? Sometimes, it’s yes to all of the above.
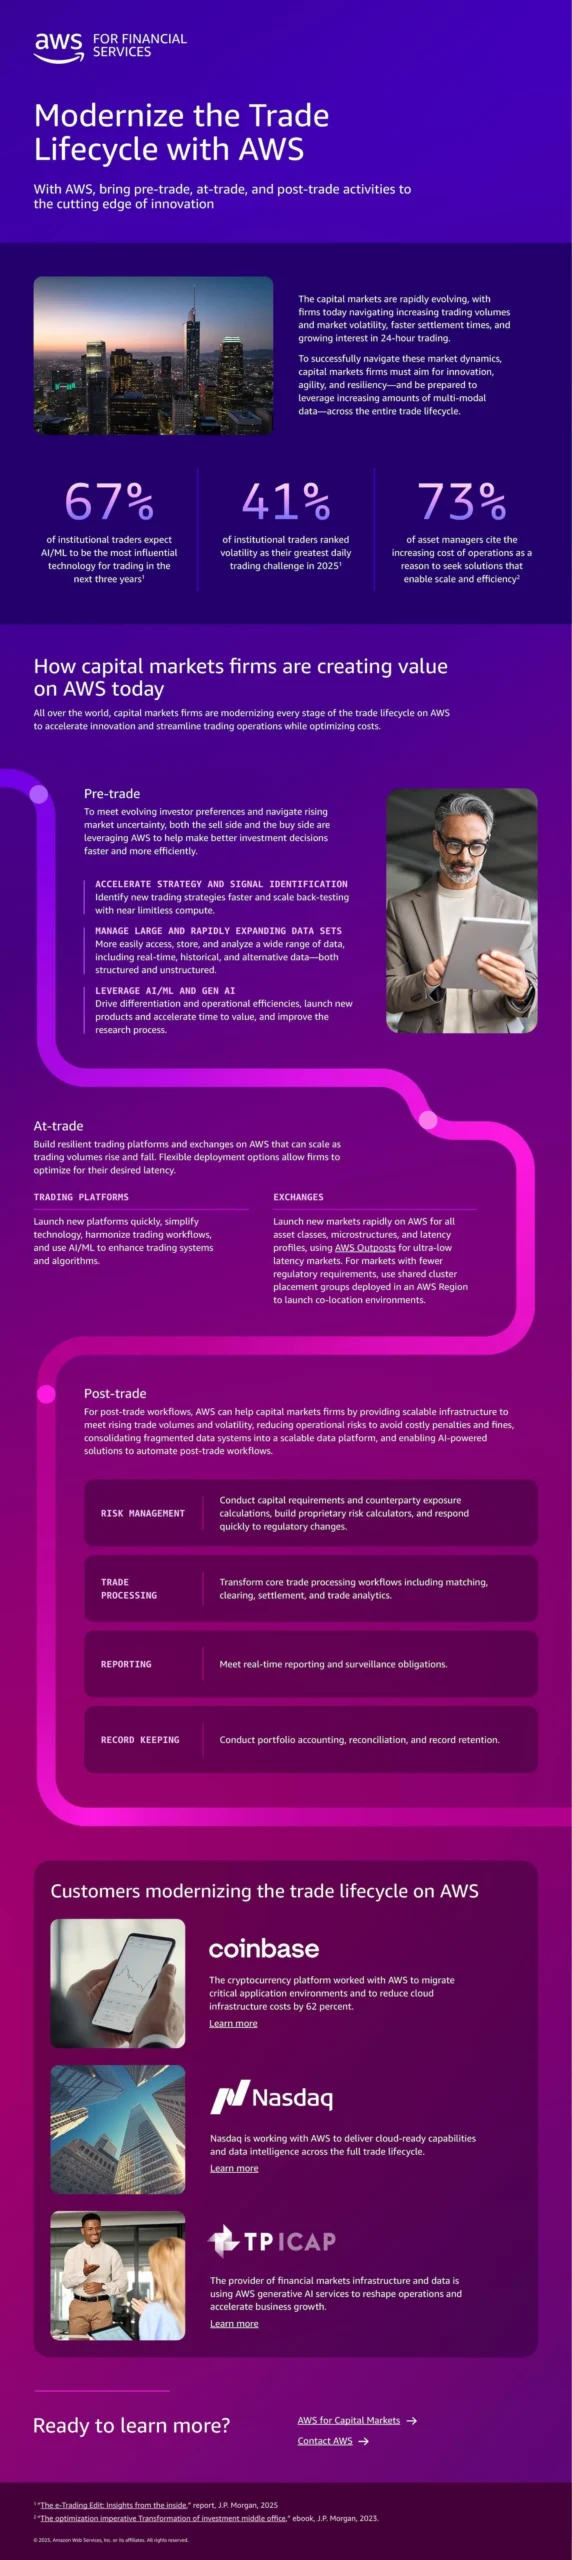
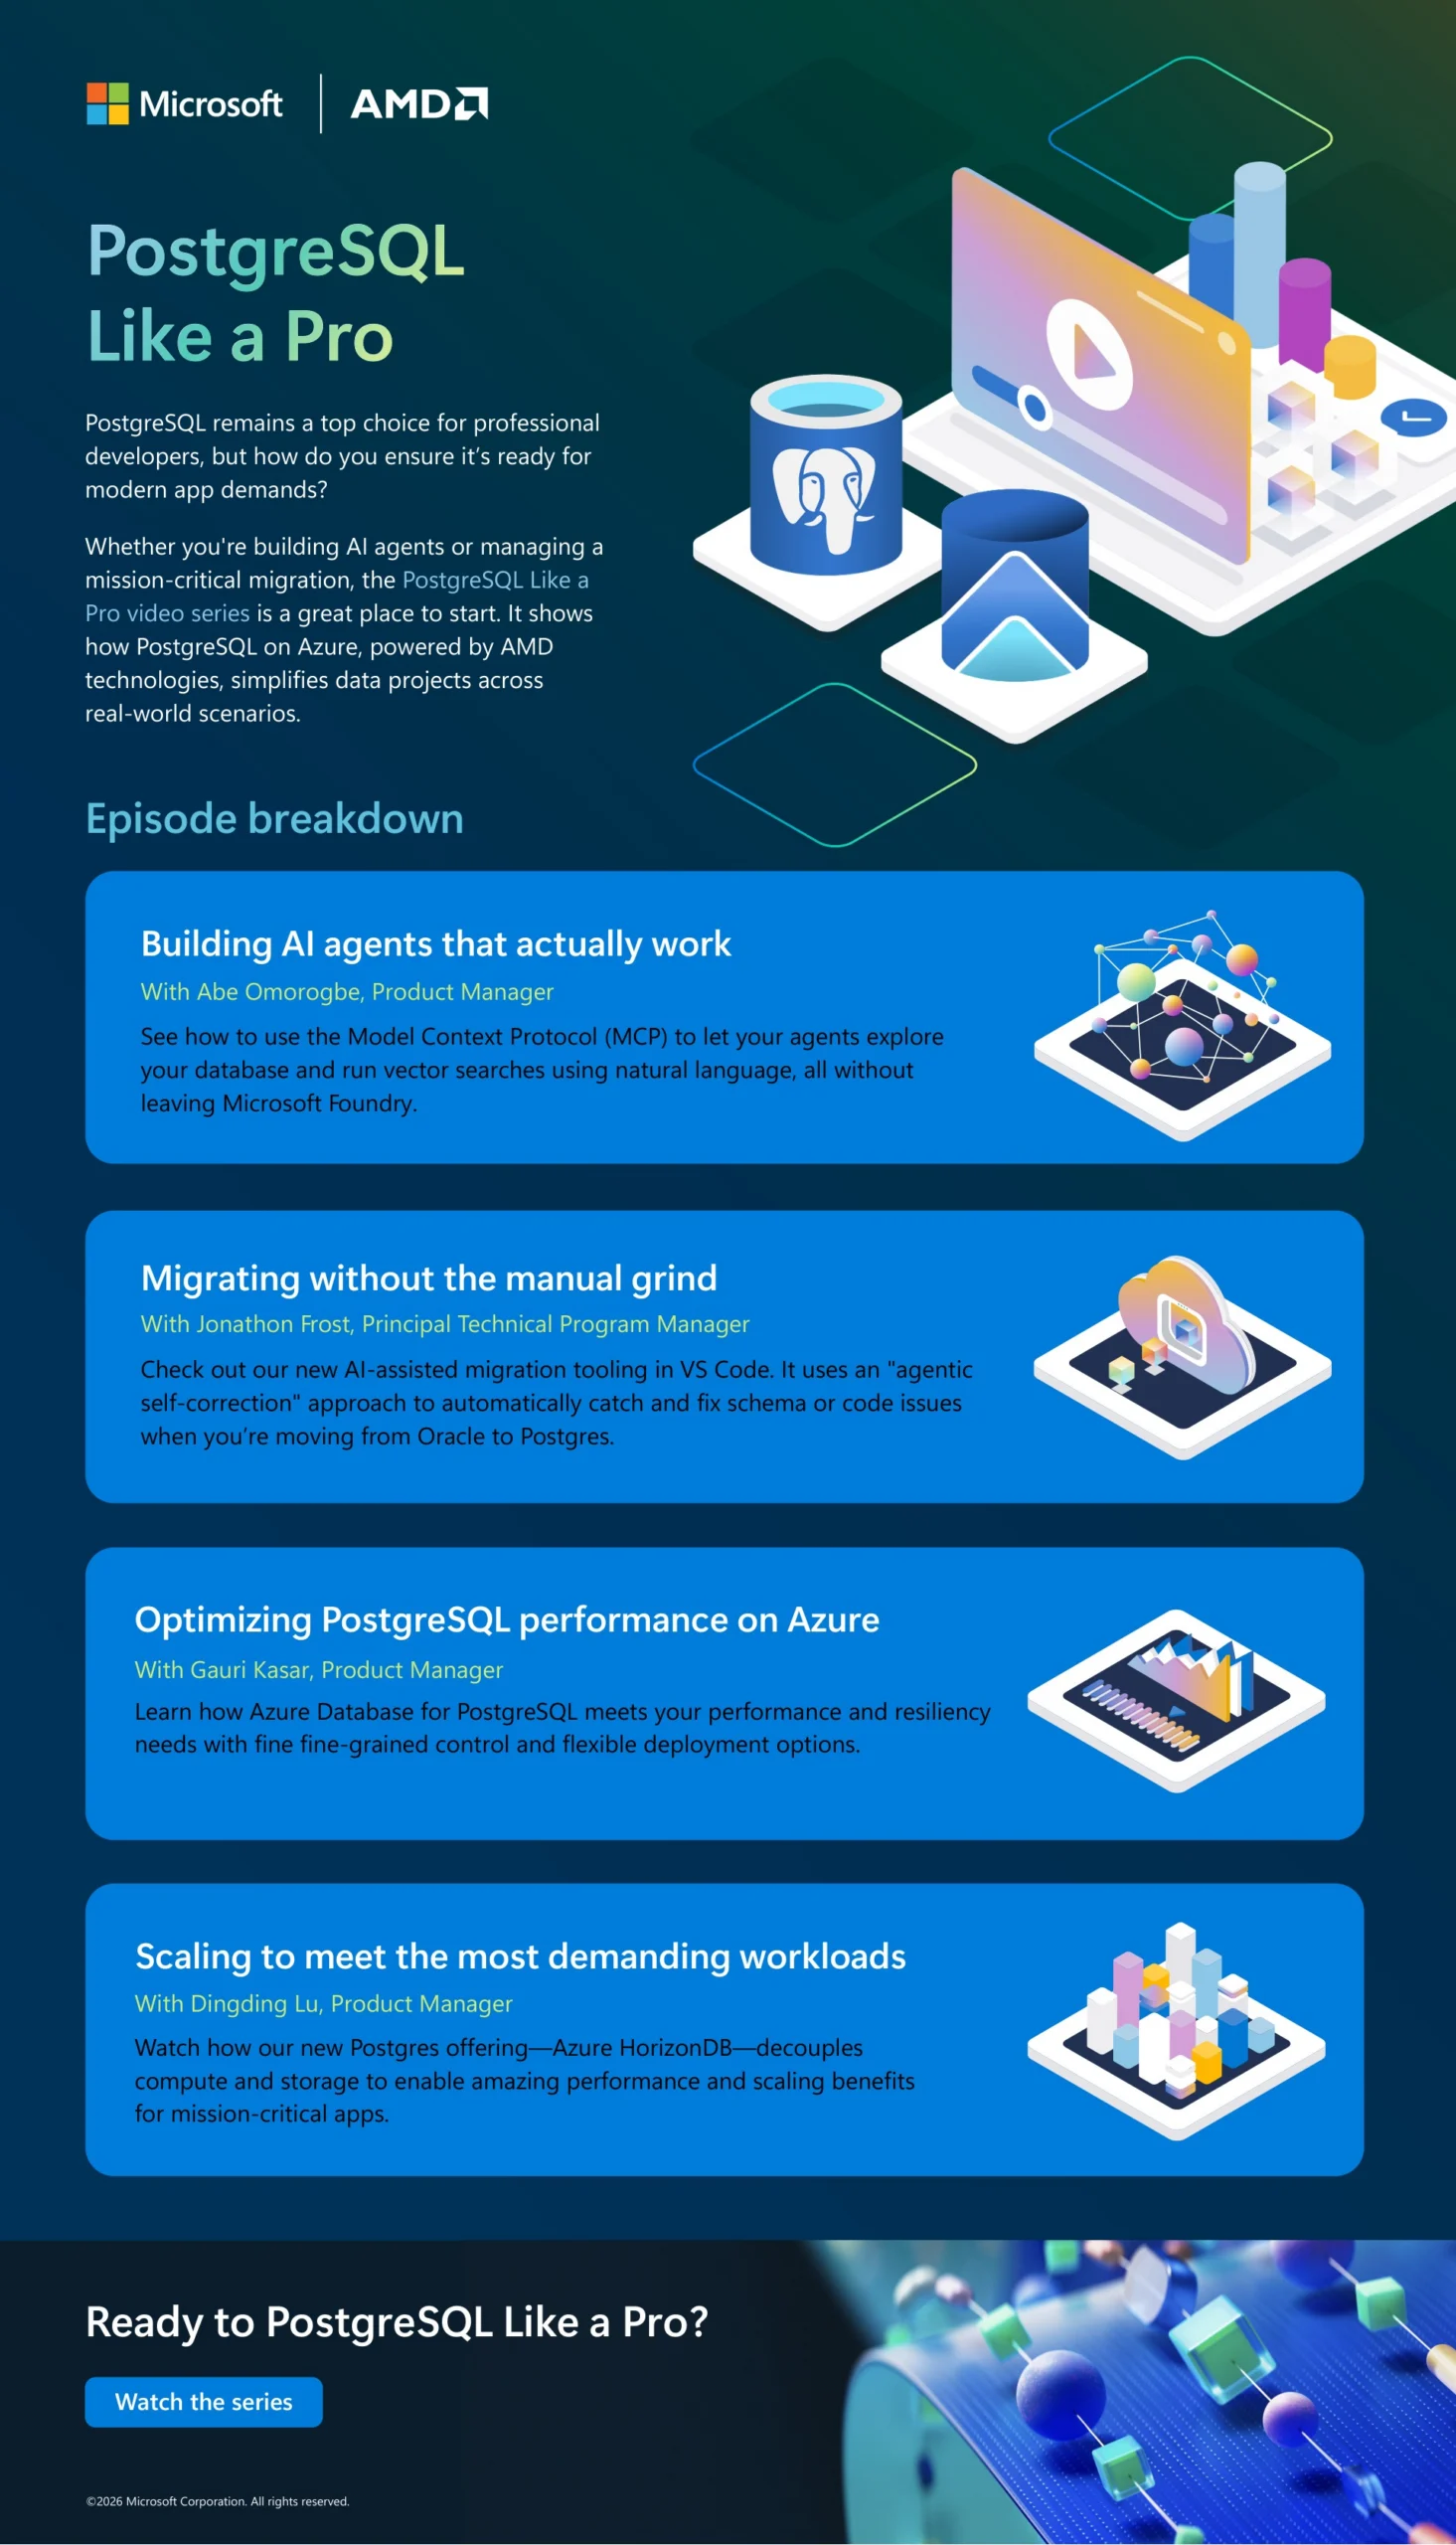
An infographic brings those pieces together around one idea worth seeing. 2A Creative turns dense source material into a visual story that helps B2B audiences spot the point quickly and remember what matters.
Examples of work


Our approach
A good infographic starts by deciding what the audience needs to see, not how much information we can squeeze onto the page. We dig through the source material to find the takeaway worth building around and the evidence that gives it weight.
Once we know where we’re going, we find the best way there. Sometimes a number needs a chart; other times, a process makes more sense when it unfolds visually. We keep the copy lean and let the graphic do real explanatory work, then make sure the finished idea can travel across the places B2B content actually lives.
Timeline
3–5 weeks
Depending on scope